-
Choerodon平台版本: 0.21
-
遇到问题的执行步骤:
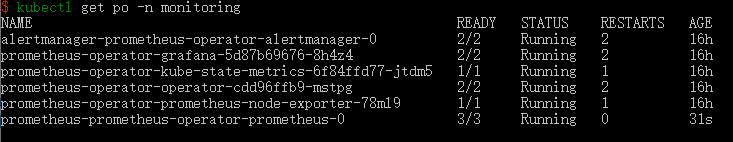
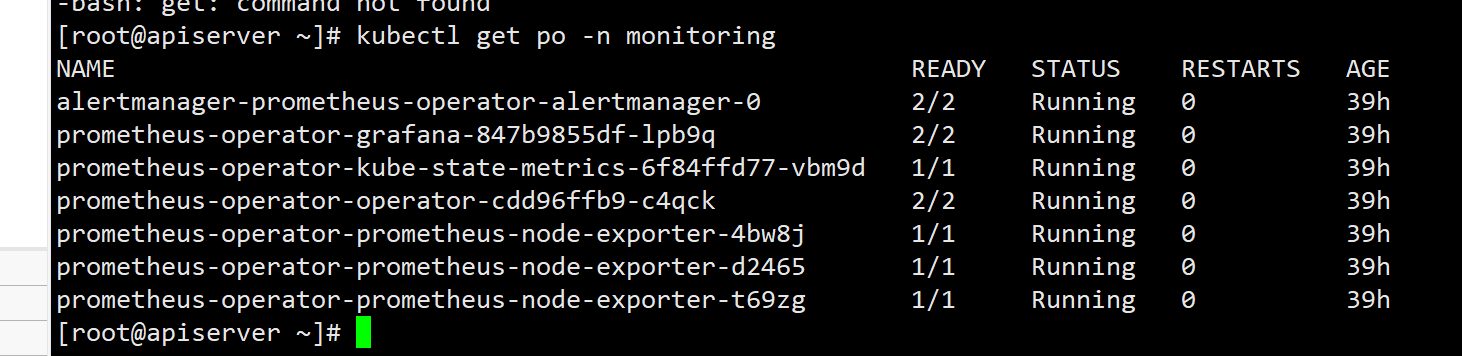
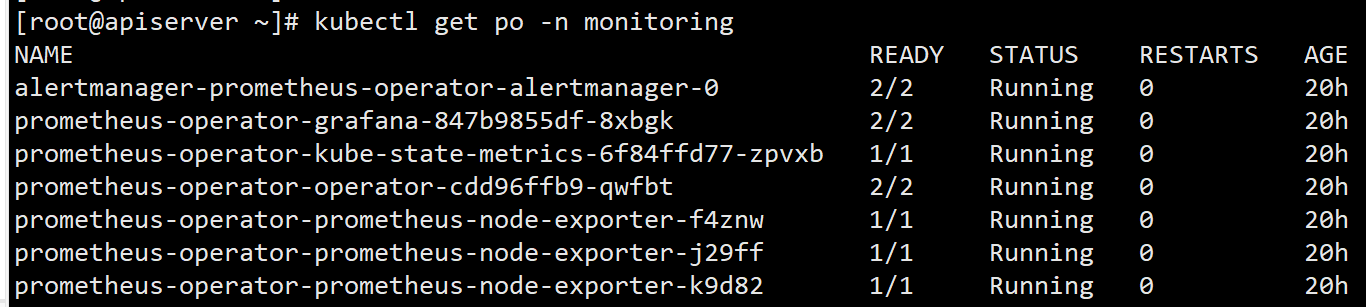
按照安装文档配置装的,安装没报错,服务都可以启动
配置文件:
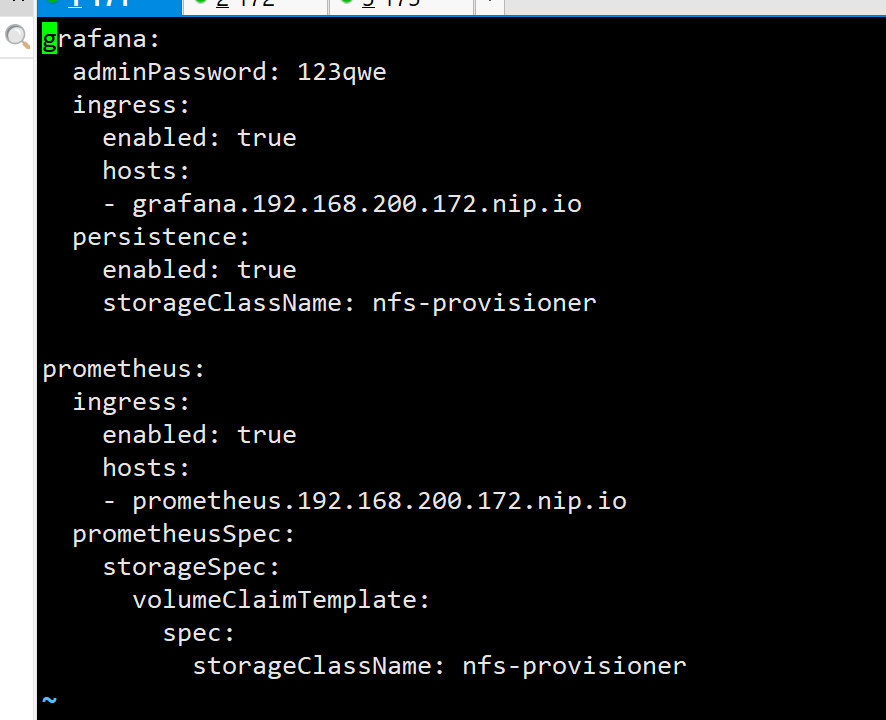
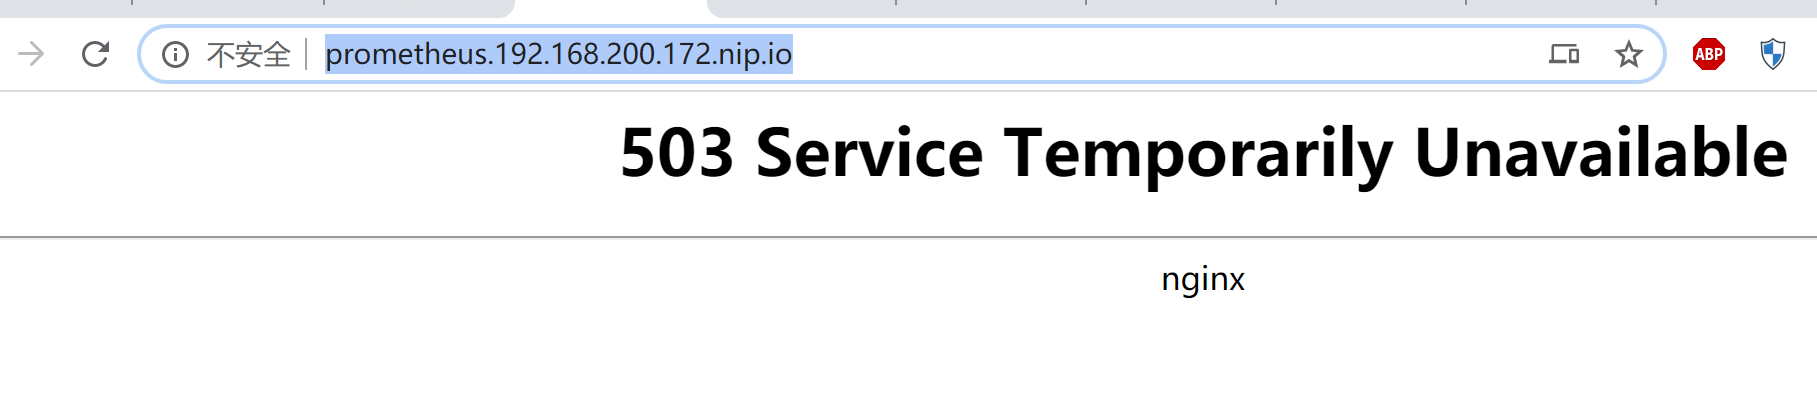
但是访问
http://grafana.192.168.200.172.nip.io/
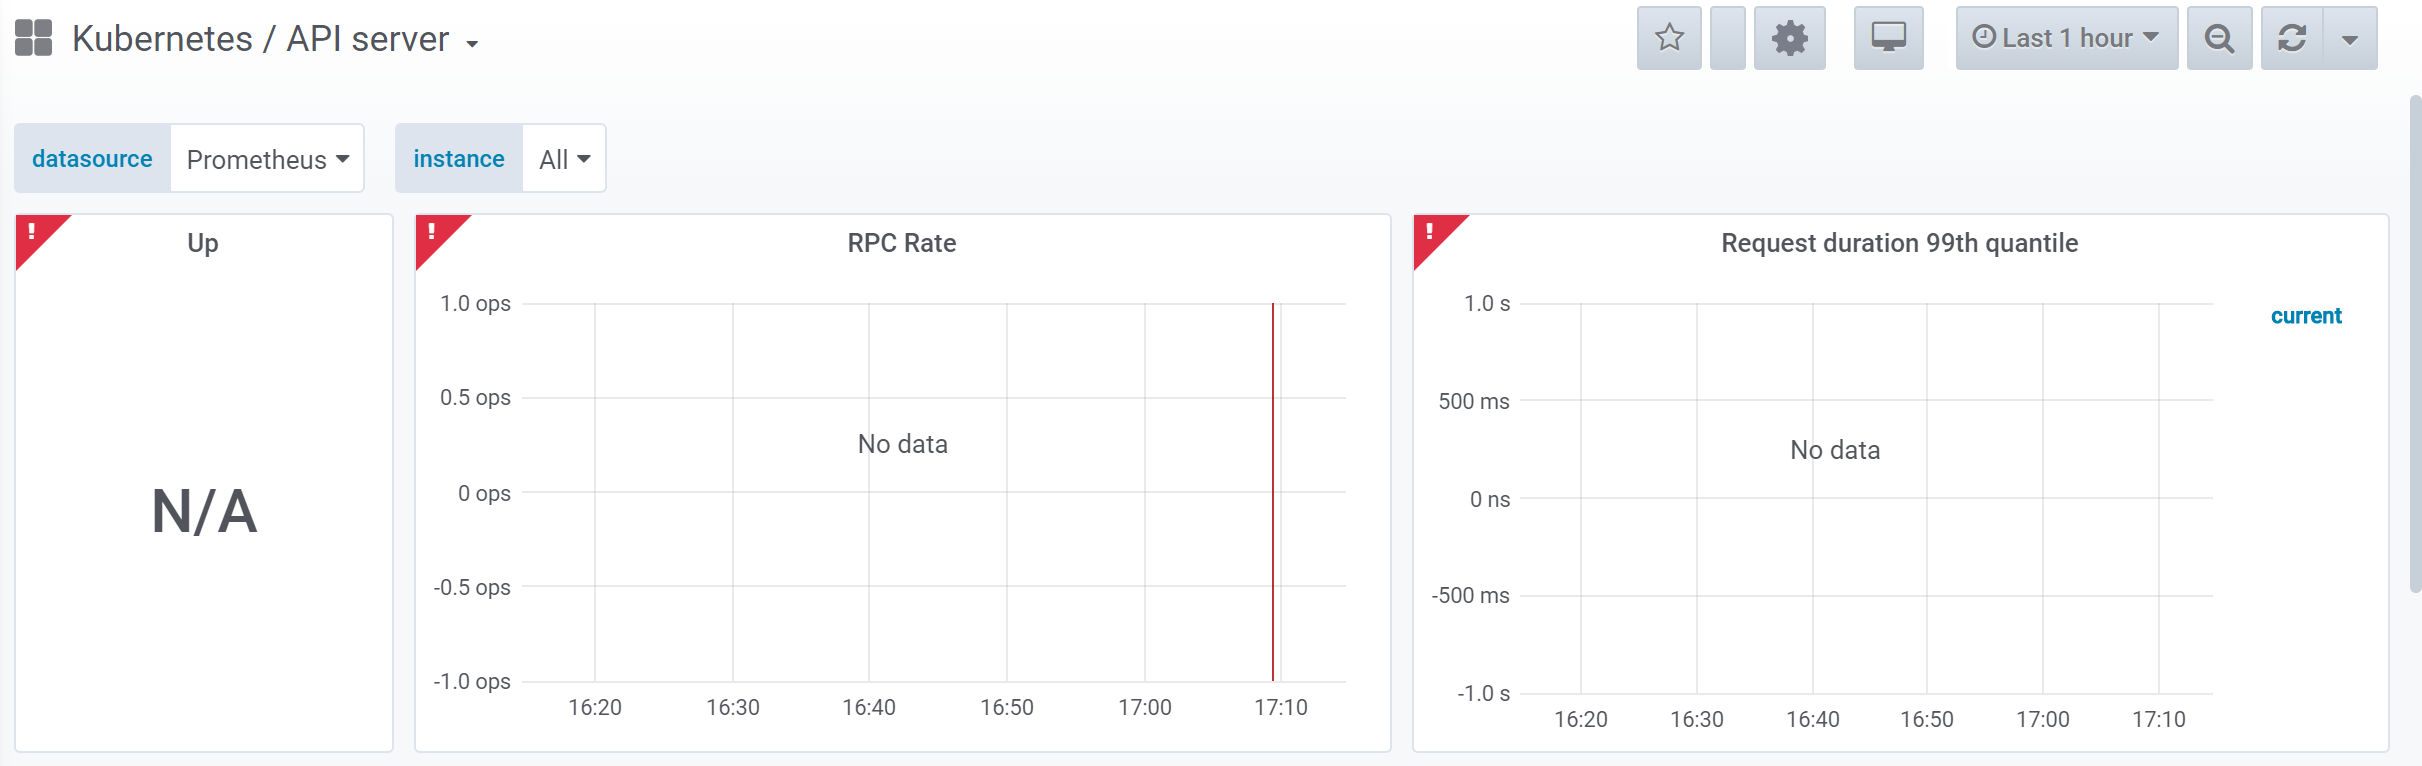
查看 任意服务均无数据,
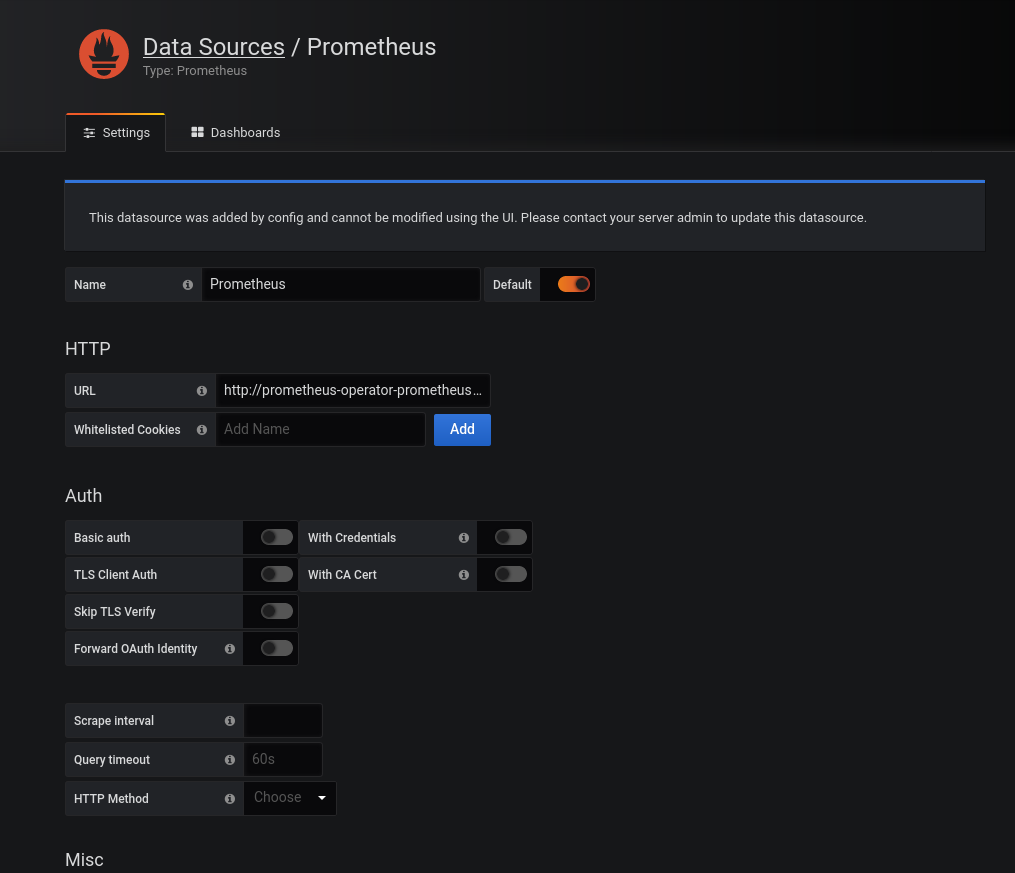
新增 Prometheus数据源 ,尝试使用
http://prometheus.192.168.200.172.nip.io:9100
http://prometheus.192.168.200.172.nip.io:9090
http://prometheus.192.168.200.172.nip.io
http://prometheus-operator-prometheus:9090
均报错
HTTP Error Bad Gateway

-
文档地址:
http://choerodon.io/zh/docs/installation-configuration/steps/operation/monitoring/ -
环境信息(如:节点信息):
-
报错日志:
-
原因分析:
提出您分析问题的过程,以便我们能更准确的找到问题所在
-
疑问:
提出您对于遇到和解决该问题时的疑问